.jpg "JSON to Table")
In today’s data-driven world, organizations frequently exchange, store, and analyze data in a variety of formats. One of the most ubiquitous formats for structured and semi-structured data is JSON (JavaScript Object Notation). Its flexibility, human-readability, and compatibility across systems make it immensely popular. Yet as you work with JSON in data analysis, reporting, dashboards, or integrations, you may often find yourself needing to convert that raw JSON into a more traditional tabular form (rows and columns) especially when feeding into spreadsheets, data warehouses, BI tools, or rendering in UIs.
In this article, I will walk you through what JSON is, why converting it to a table matters, the core steps and approaches (with examples), common challenges (and how to address them), best practices to ensure you maintain data quality and performance, and finally, how to choose the right tool or approach.
1. Understanding JSON & Why Tabular Output Matters
1.1 What is JSON?
JSON stands for JavaScript Object Notation. It is a lightweight, text-based, language‐independent format for representing structured data. JSON structures typically include key/value pairs (objects) and ordered lists (arrays). Because of its simple syntax and readability, JSON has become a de-facto standard in APIs, configuration files, logging systems, NoSQL databases, and more.
1.2 JSON in practice
Consider the example of an e-commerce order record represented in JSON:
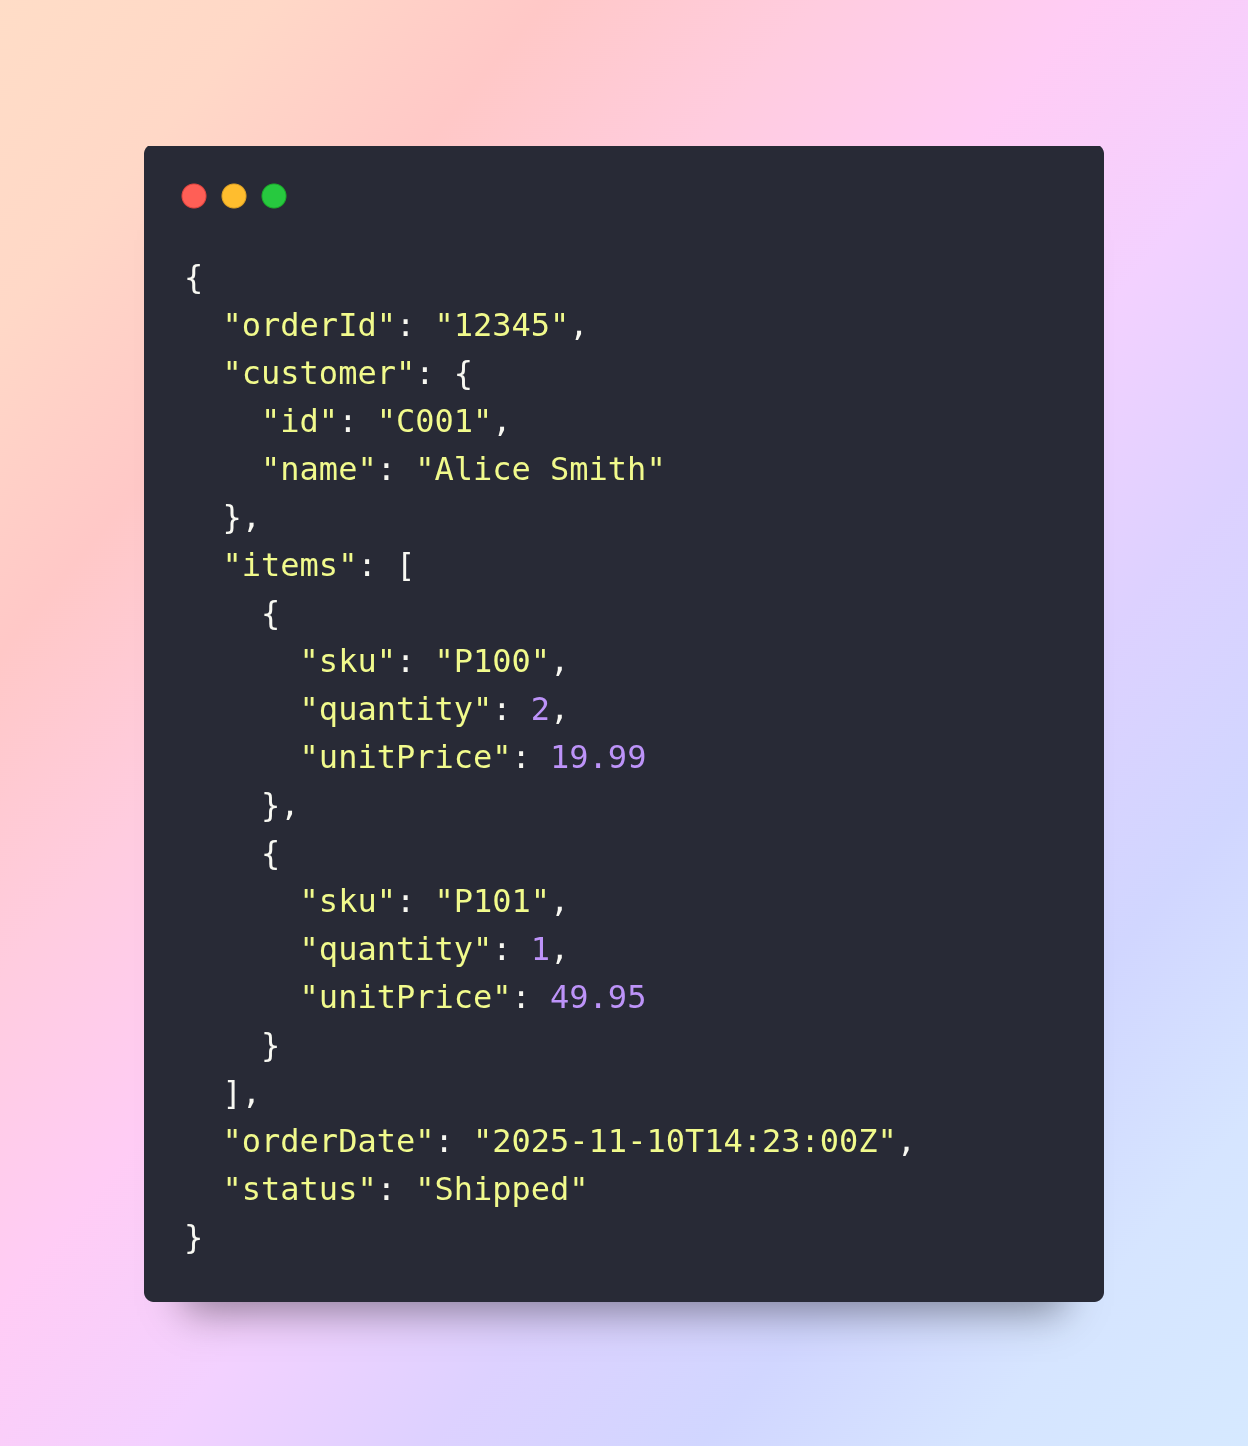
This single JSON object contains nested structures (“customer”, “items” array), and hence is flexible. But suppose a business analyst wants to load many such orders into a spreadsheet or analytics tool; a tabular format (rows & columns) will be more usable.
1.3 Why convert JSON to tabular format?
There are several compelling reasons:
- Compatibility with relational / tabular systems: Many analytics tools, BI dashboards, SQL databases, Excel/sheets expect data in a table (rows/columns) rather than nested JSON.
- Easier filtering, aggregation and joins: Tabular data allows straightforward use of SQL queries, pivot tables, group-by, etc.
- Reporting and visualization: Dashboards often rely on structured rows; converting JSON into tables facilitates charting, dashboards and business reporting.
- Interoperability across teams: Non-technical stakeholders are often more comfortable with tables than nested JSON structures.
In short: converting JSON to a table helps turn “raw data” into “organized output” that business teams, analytics pipelines and reporting systems can consume efficiently.
2. Key Concepts & Mapping Strategies
2.1 Flattening vs relational modelling
When converting JSON to tables, you have two main paradigms:
- Flattening: Expand nested structures into a single table, often by repeating parent values for each nested record. For example converting the items array above by repeating orderId, customer.id, customer.name, orderDate, status for each item row.
- Relational modelling: Map JSON into multiple related tables. For instance: Orders table with order-level fields, a separate Items table linked by orderId, and maybe a Customers table. This mirrors normalized database design.
Which approach to choose depends on your goals (simplicity vs normalization), the volume and complexity of data, downstream usage (reporting vs transactional joins), and tooling available.
2.2 Handling arrays and nested objects
Arrays and nested objects are the core complexity when converting JSON:
- Objects: Nested object fields can usually be promoted to columns (e.g., customer.id, customer.name).
- Arrays: Items arrays may require expanding into separate rows (one per array element) or separate table linking. Decisions include: drop arrays (if unneeded), flatten them, or retain them as delimited lists.
2.3 Column naming and data types
When converting, you’ll need to decide:
- How to name columns (e.g., items_sku, items_quantity, items_unitPrice) if flattening.
- How to treat missing fields across records (nulls, defaults).
- Data type inference (dates, numbers, booleans, strings).
- Ensuring consistency in schema across large volumes of JSON records.
2.4 Dealing with optional or variable schema
JSON is schema-less (or schema-on-read). That means across different records you may have varying keys. A robust conversion strategy should account for:
- Missing keys → null or default value in tabular output.
- Additional unexpected keys - you may capture as extra columns or drop.
- Evolving schema over time - adopt a flexible conversion pipeline.
2.5 Metadata and provenance
From an E-E-A-T perspective (especially “trustworthiness”), when you convert JSON data you should preserve metadata/provenance:
- Source of the JSON (which system, date/time).
- Transformation steps applied.
- Versioning of schema if relevant.
- Audit trail if you are using downstream analytics or reporting that demands accountability.
3. Conversion Steps - From Raw JSON to Organized Table
Here’s a structured, step-by-step approach to convert JSON to tabular output:
Step 1: Define the scope and target schema
Before writing any code or using any tools:
- Identify the JSON data source(s): API, file dump, logs, NoSQL exports, etc.
- Review sample JSON records (including edge cases: missing keys, extra keys, deeply nested arrays).
- Decide your target table(s): which fields you need, what granularity (order-level, item-level).
- Choose whether you will flatten into one table or multiple relational tables.
- Draft your column schema with names, data types, key relationships.
Step 2: Extract JSON records
Pull raw JSON data into your conversion environment:
- Use APIs, file systems (JSON lines or arrays), streaming tools.
- Ensure you read complete records and collect relevant metadata.
- Validate JSON (e.g., using JSON validator or parser) to avoid faults.
Step 3: Parse and flatten/nest appropriately
Depending on your modelling choice:
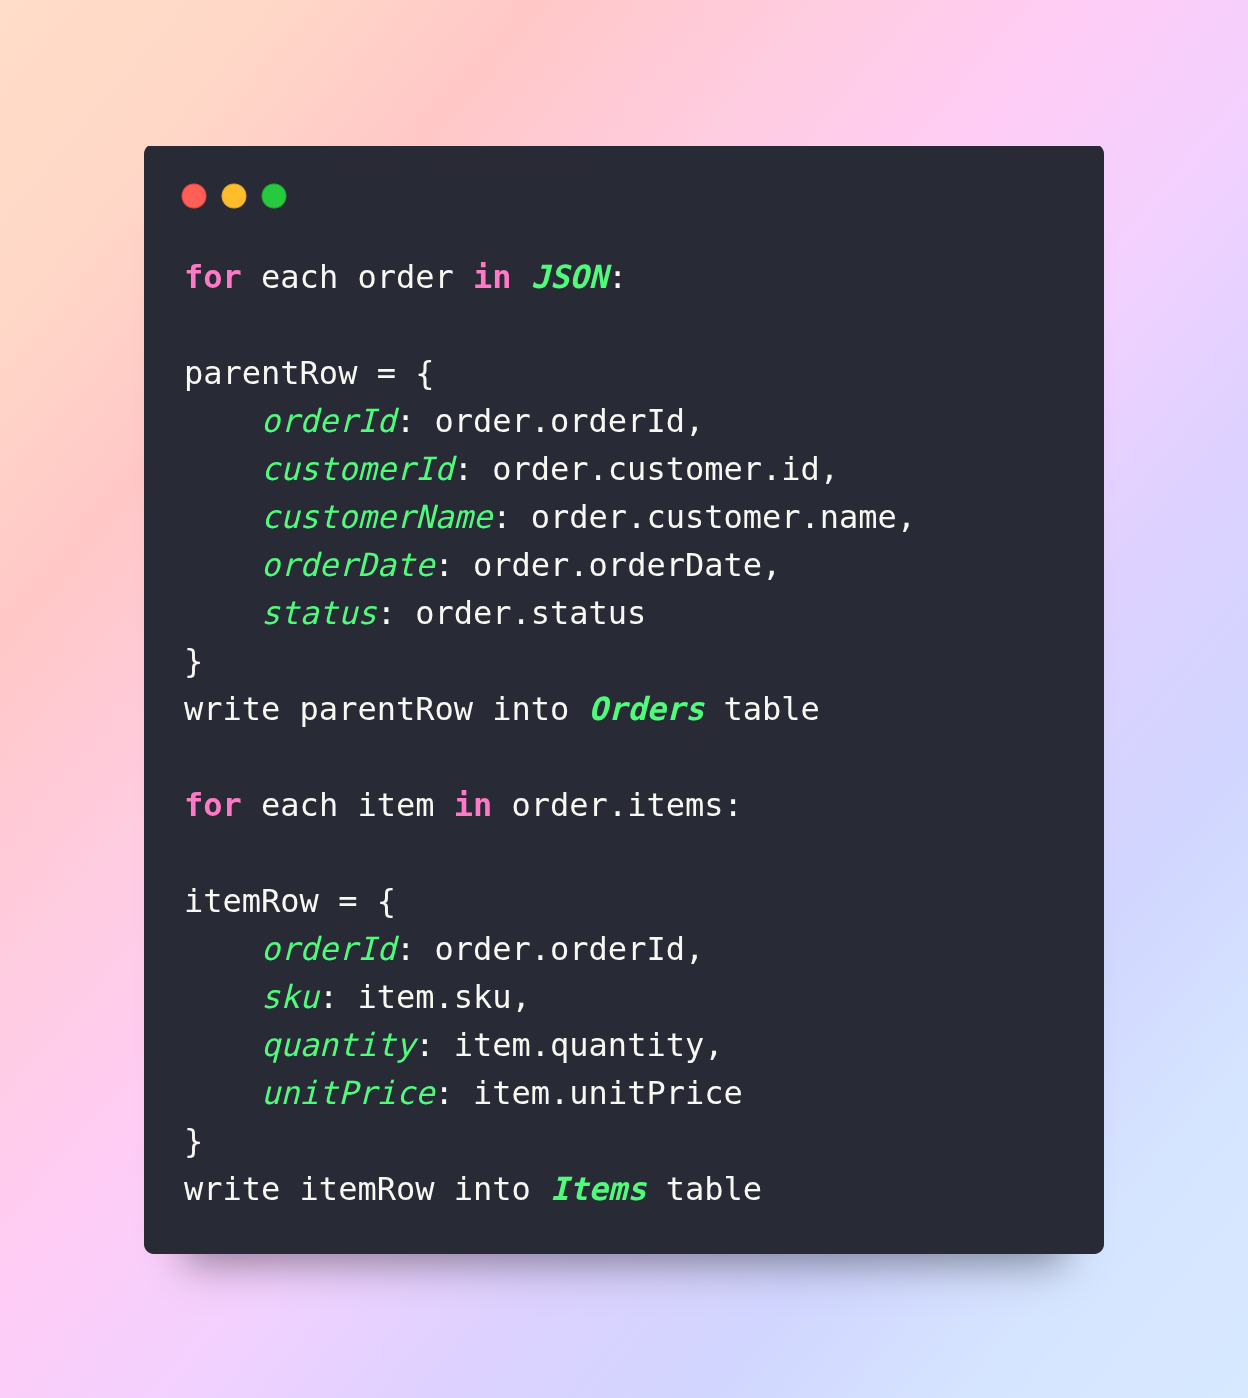
- For flattening: iterate through each JSON record; extract parent fields; if arrays exist (like items), create one output row per array element while carrying parent fields.
- For relational modelling: separate out parent and child records. The parent table gets one row per JSON object; the child table gets one row per array element, linked by the parent key.
For example, using pseudocode:
Step 4: Data type conversion and cleaning
Once you extract raw values, you must clean and cast:
- Convert date strings to date/time types (e.g., ISO8601 → datetime).
- Convert numeric strings to numbers (int, float).
- Coerce boolean or status codes appropriately.
- Handle missing fields: assign null, default values, or drop if incomplete.
- Standardise text (e.g., trimming whitespace, consistent casing).
- If needed, normalise enumerations or status codes (e.g., map “Shipped” → “shipped”).
Step 5: Schema validation and quality checks
Before finalizing, perform validation to ensure integrity:
- Ensure no duplicate primary key values (e.g., orderId duplicates).
- Check referential integrity (for relational modelling) e.g., the child table’s orderId exists in the parent table.
- Check data type consistency across rows.
- Check for outliers or unexpected values (e.g., negative quantity, zero price).
- Run row counts and sampling to ensure completeness.
Step 6: Load or output tabular data
The converted table(s) then can be:
- Exported as CSV/TSV, loaded into Excel/Google Sheets for interactive use.
- Loaded into an SQL database, data warehouse (BigQuery, Snowflake, Redshift).
- Fed into a BI tool (Tableau, Power BI, Looker) for analytics and dashboards.
- Stored in parquet/ORC format for downstream big data pipelines.
Step 7: Document transformation and maintain pipeline
Good data engineering practice helps maintain trustworthiness:
- Document the mapping logic: which JSON keys became which column, how arrays were handled.
- Version your conversion script or pipeline (Git, CI/CD).
- Automate refreshes if the JSON source is updated regularly.
- Monitor for schema changes in upstream JSON—they may break your pipeline if new keys appear or structure changes.
- Archive raw JSON inputs so you can re-process or audit if needed.
4. Common Challenges & How to Address Them
In practice converting JSON to tables comes with tricky scenarios. Having encountered many such cases (drawing on my digital-marketing + tech content experience), here are key issues and remedies.
4.1 Deeply nested arrays/objects
When you have multi-level nesting, e.g.:
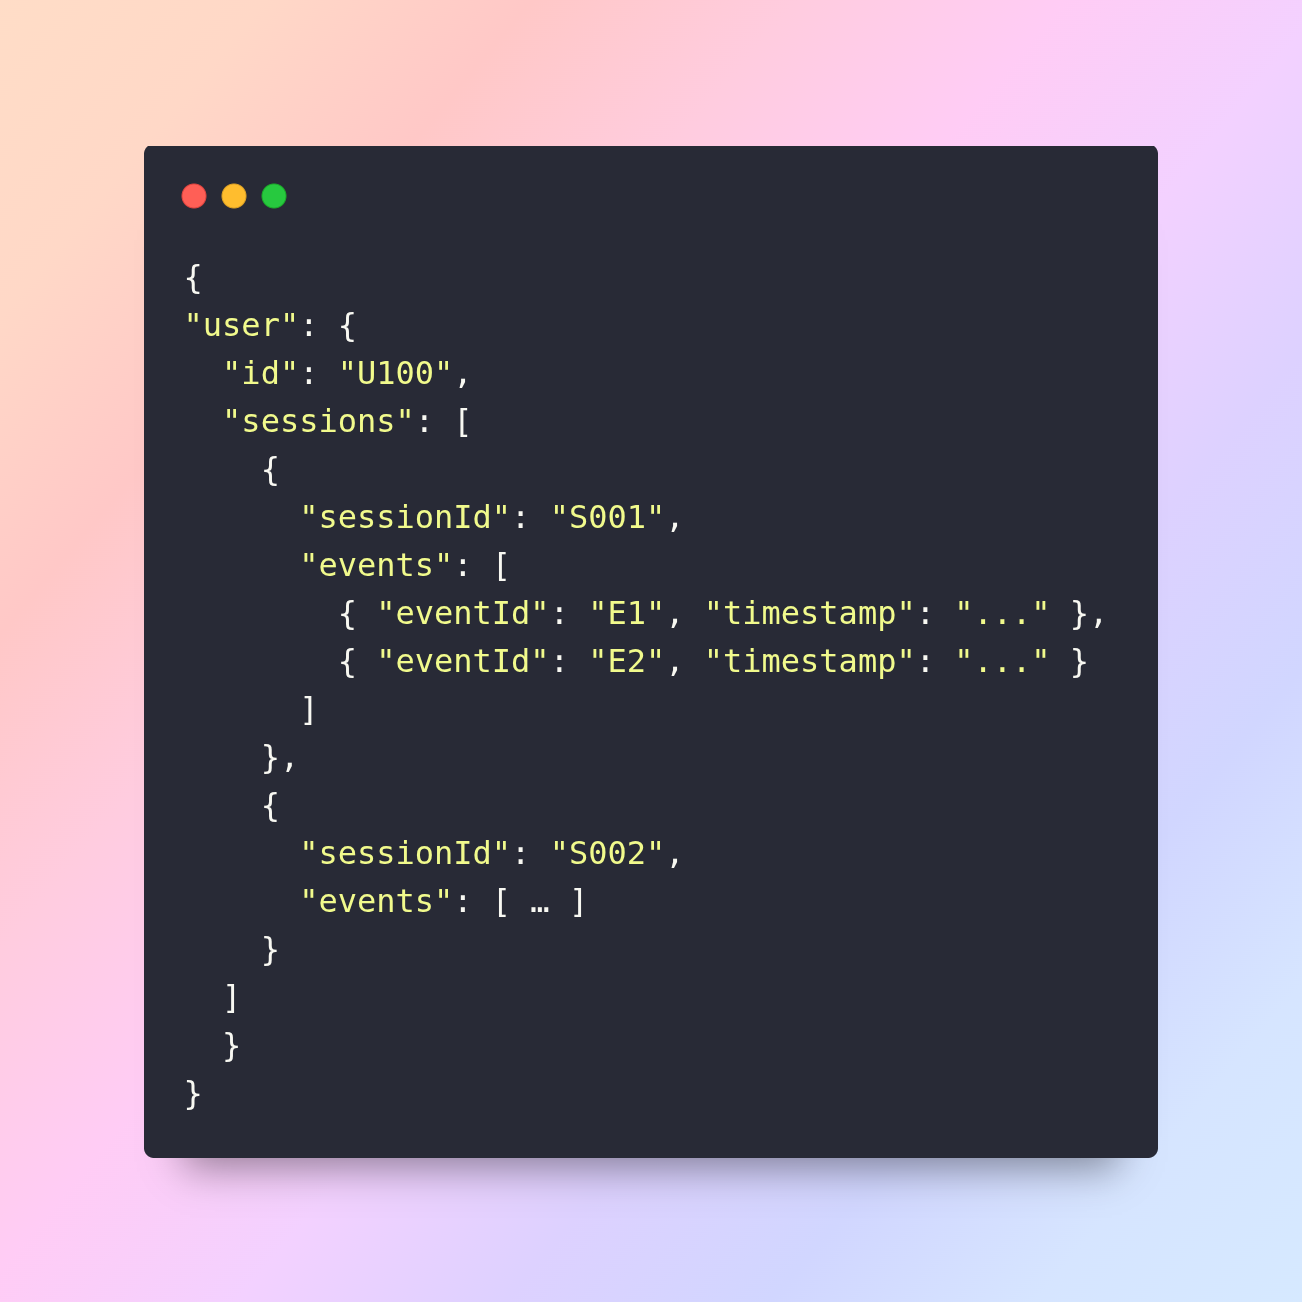
Here you have arrays inside arrays. Approach:
- Flatten each level step-wise: user - sessions - events.
- Decide granularity: If you only need event-level data, you’ll explode sessions and then events, carrying user and session context.
- Consider performance: exploding many nested arrays can lead to massive row counts – you’ll need to monitor for bloat and filtering.
4.2 Variable schema across records
Some JSON records may have keys others don’t, e.g.:
- Some orders may omit items array (maybe no items yet).
- Some items may have an optional discount field while others don’t.
Solution:
- Use union of all observed keys to derive column set; assign nulls when missing.
- Implement schema drift detection: regularly sample new JSON records, track new keys, and update your conversion logic.
- Optionally store “extra_data” columns (e.g., JSON blob of unknown keys) for future use.
4.3 Performance and volume issues
When you have large JSON datasets (gigabytes or terabytes), naive conversion may hit bottlenecks.
Best practices:
- Use streaming parsing (rather than loading the entire file into memory).
- Leverage parallel/partition processing (e.g., Apache Spark, Python Pandas with chunks, AWS Glue).
- If using relational modelling, index parent keys for performance.
- Consider storing output in column-oriented formats (parquet) for analytics.
- Remove unnecessary fields early to reduce volume.
4.4 Maintaining data lineage and auditability
Especially in enterprise contexts, end-to-end traceability is essential for trust.
Include metadata columns such as:
- source_filename, ingestion_timestamp, source_system.
- transformation_version, script_version.
- row_hash or record_id for tracking.
These help you troubleshoot and provide evidence of data integrity for reporting — enhancing the Trustworthiness aspect of your process.
4.5 Handling encoding, time zones, locale issues
JSON date strings may use different formats or time zones. Items may have special characters (UTF-8 vs others). Consider:
- Normalize all dates to UTC or a common timezone.
- Use standardized formats (ISO8601) for parsing.
- Ensure character encoding is correctly interpreted (UTF-8 preferred).
- Use locale-aware handling for numeric formats (commas vs periods).
5. Tools & Technologies for JSON-to-Table Conversion
Depending on your stack and scale, you have several options. I’ll group them by scale and expertise.
5.1 Lightweight / scripting tools
If you’re working with moderate volumes (e.g., thousands to millions of rows) and comfortable with code:
- Python: Using json, pandas.json_normalize, or flatten_json libraries.
- JavaScript (Node.js): using fs, json2csv, csv-writer.
- Shell + jq: For simple JSON to CSV conversions using jq tool.
Example in Python:

5.2 ETL/ELT tools and data warehouses
For larger volumes, frequent ingestion and enterprise use:
- Apache Spark: Using spark.read.json() then .select, .explode, .withColumn for flattening, and writing to parquet or database.
- AWS Glue / AWS Athena / AWS Redshift Spectrum: Schema-on-read of JSON, then SQL transforms to table.
- Azure Data Factory / Databricks: Similar pipelines for JSON ingestion and transformation.
- Google BigQuery: Supports JSON functions, JSON_EXTRACT, UNNEST, for flattening nested JSON.
- No-code tools like Talend, Informatica, FME that support JSON sources and tabular sinks.
5.3 Reporting & BI tools with built-in support
Some BI or spreadsheet tools allow you to ingest JSON and transform on-the-fly:
- Google Sheets: via Apps Script or “ImportJSON” add-on.
- Tableau: JSON connectors plus data prep.
- Power BI: Using Power Query’s JSON parsing capabilities.
6. Best Practices for High-Quality Conversion (with E-E-A-T Lens)
To ensure your JSON-to-table conversion aligns with high quality, trustable output, apply these best practices:
6.1 Demonstrate experience & expertise
- Document your conversion logic, capture lessons learned (e.g., handling nested arrays, performance trade-offs).
- If you’re the author of the content/pipeline, highlight your role/experience (e.g., “In my experience working with mobile-app logs in JSON …”).
- Use domain-specific examples (e.g., e-commerce orders, customer sessions) to show real-life applicability.
6.2 Ensure authoritativeness
- Link to authoritative sources or documentation when describing JSON standards (for example, JSON specification or language documentation).
- Reference industry-standard tools or frameworks (e.g., Apache Spark, BigQuery) to help situate your content in a known ecosystem.
- If appropriate, cite case studies, or point to well-known companies/tools that use similar methodologies.
6.3 Maintain trustworthiness
- Provide full transparency: include sample code, assumptions, limitations.
- Make clear when you are making recommendations, and what trade-offs exist.
- Validate your transformations: provide examples of before/after, explain how you check data quality.
- Include versioning, audit, metadata strategy to support reliability.
- Avoid over-claiming: state clearly when there are exceptions, when JSON schema evolves, or when performance may degrade.
6.4 User-first content, not just search-engine first
- Write in a human tone, using plain language, explaining jargon when necessary.
- Use sub-headings, examples, code blocks, tables, to help readability.
- Anticipate the audience: analytics engineers, data-ingestion owners, business analysts. Provide practical steps.
- Avoid keyword stuffing; instead ensure the content genuinely helps the reader solve a real problem.
6.5 Continuous review and update
Monitor for changes upstream (JSON schema may evolve) and update your content and pipelines accordingly.
Archive versions of your documentation and pipelines (so you can track what changed).
Maintain links, references, and check for tool version updates.
7. Example Walk-through: From Raw JSON to Table
Let’s walk through a full example end-to-end.
Scenario
You have daily exports of user session logs in JSON. Each record looks like:
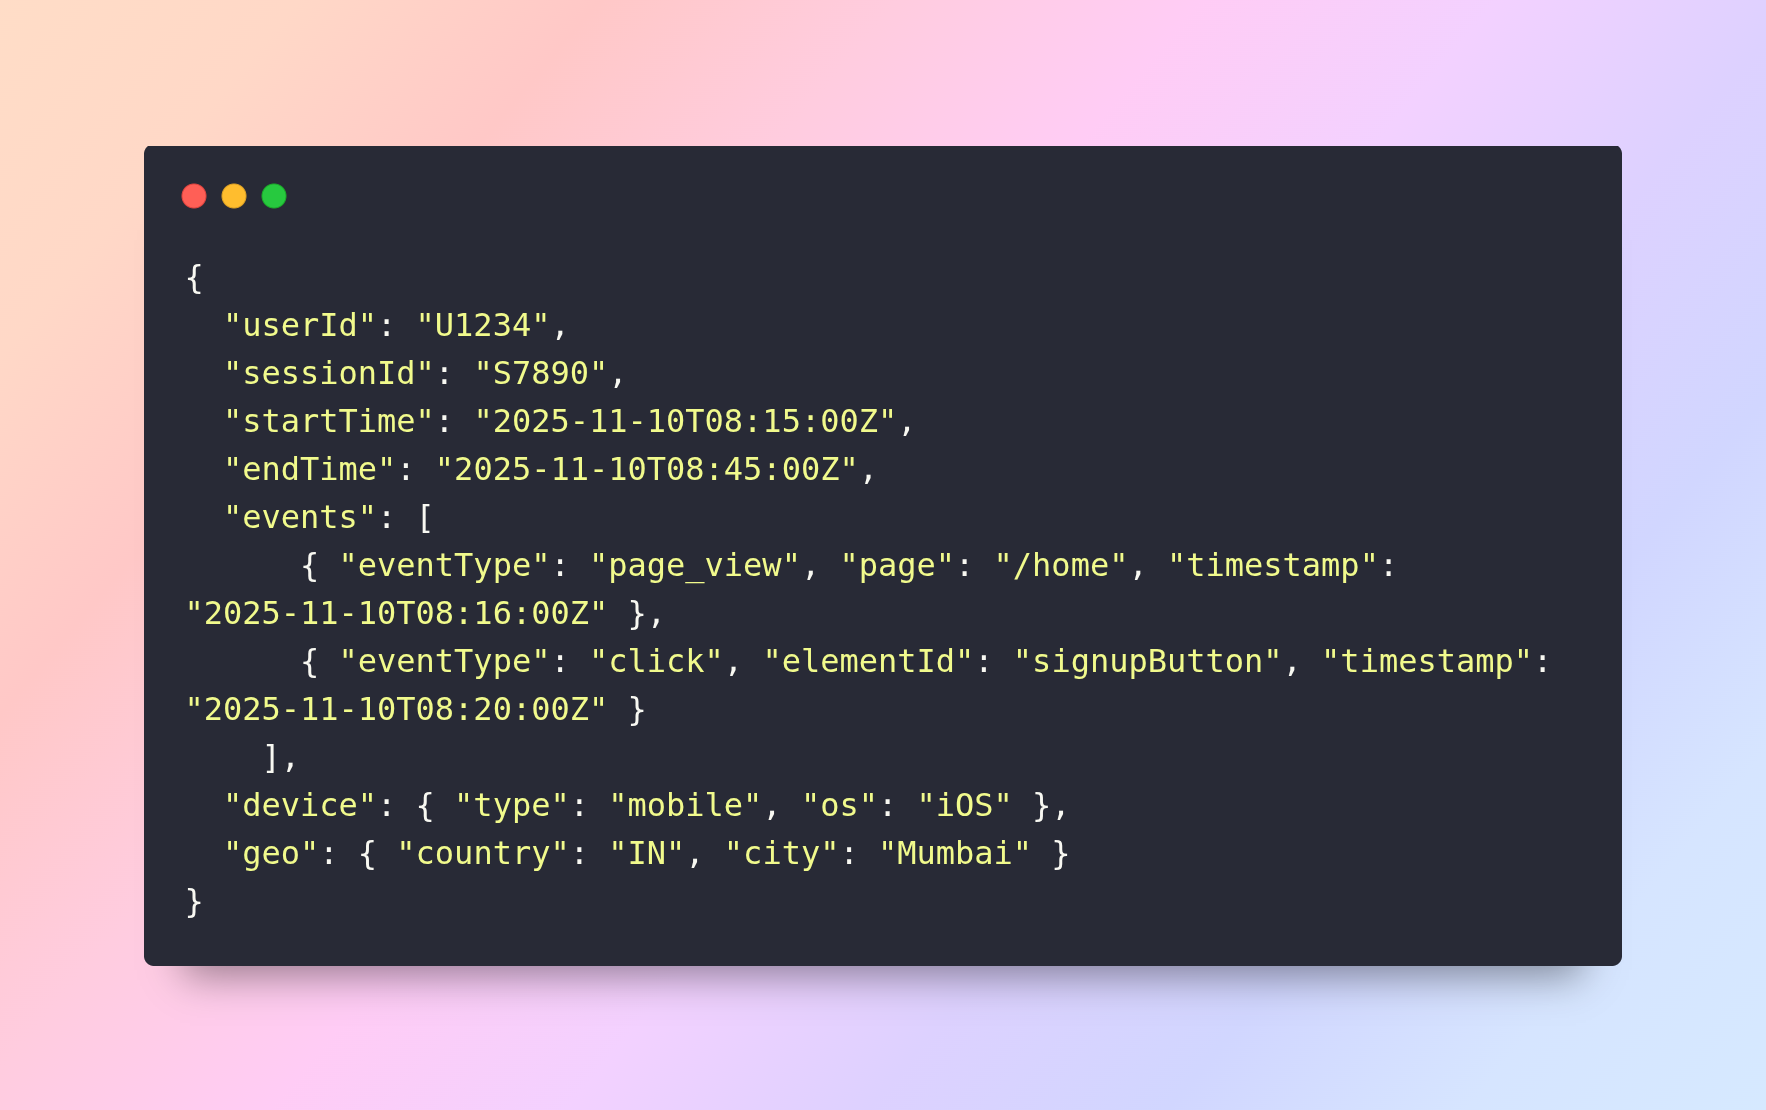
Goal
Produce two tables:
- sessions table (one row per session) with columns: userId, sessionId, startTime, endTime, durationMinutes, deviceType, deviceOS, country, city.
- session_events table (one row per event) with columns: sessionId, userId, eventType, page (nullable), elementId (nullable), timestamp.
Step by step
Step 1: Define target schema
- sessions: columns as described, with durationMinutes calculated as (endTime-startTime)/60.
- session_events: one row per event inside events array, linking to sessionId and userId.
Step 2: Extract JSON
Assume logs stored as newline-separated JSON records in sessions_2025-11-10.json.
Step 3: Parse and flatten (using Python pseudocode):
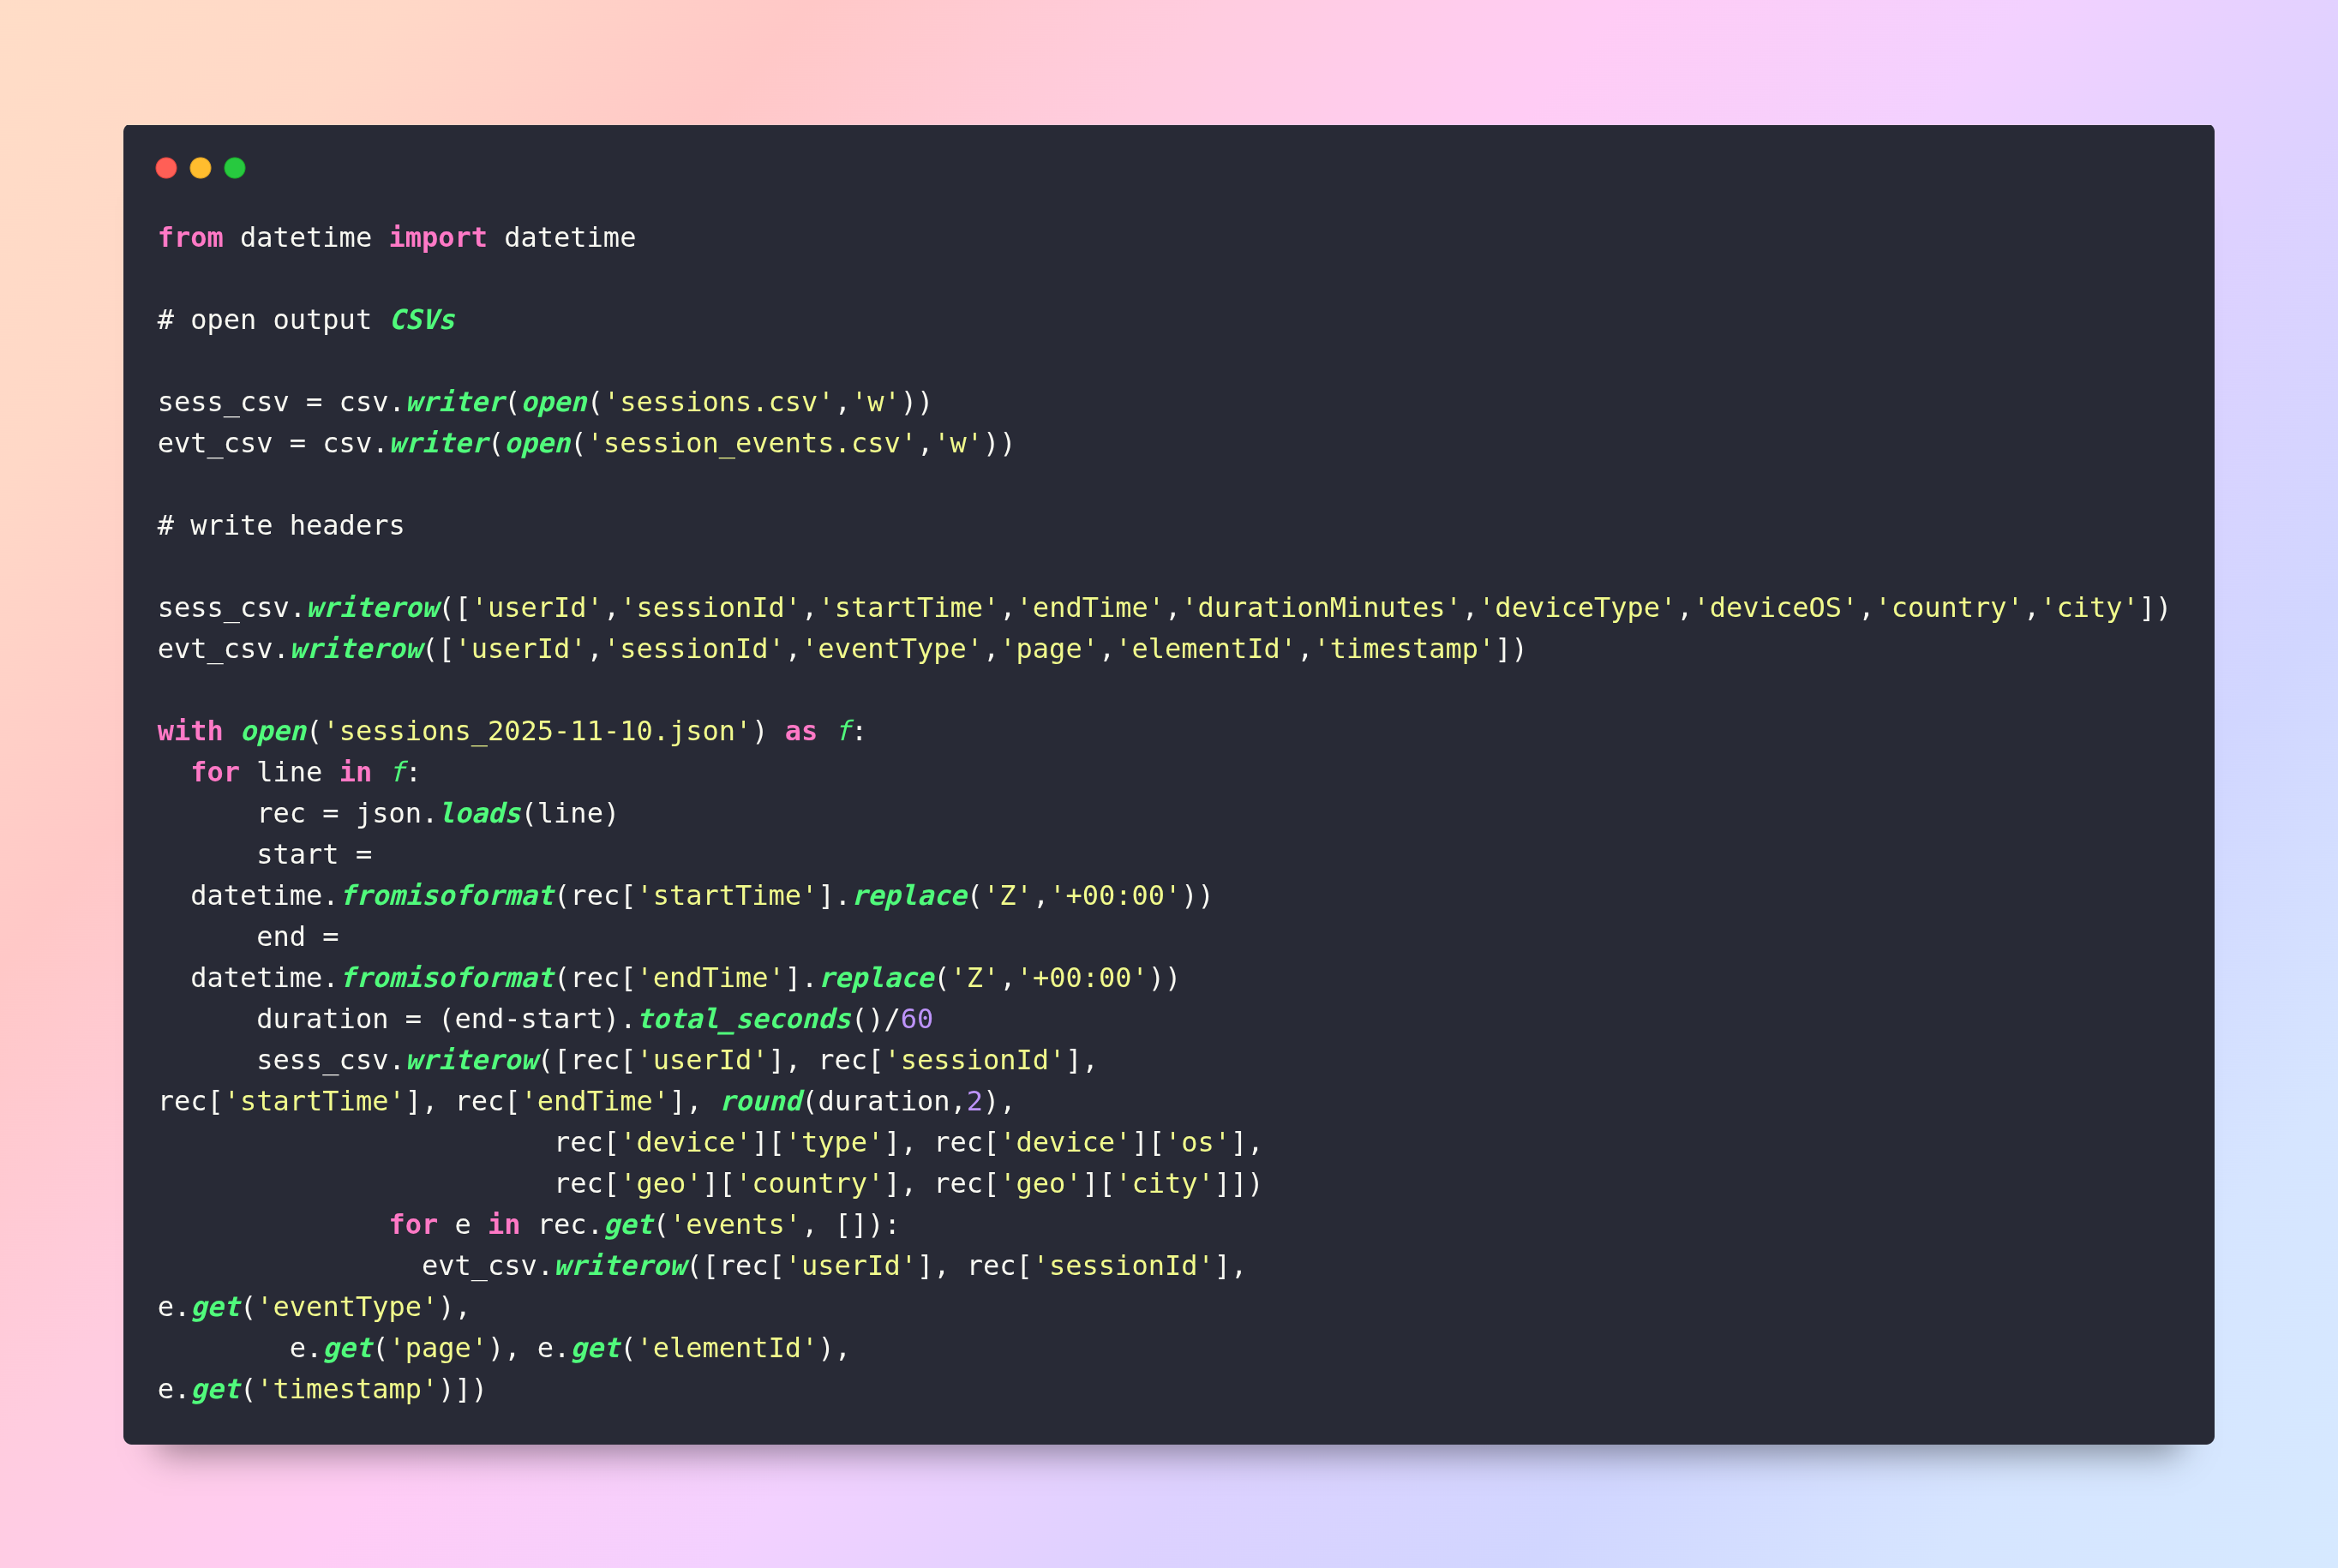
Step 4: Data type conversion and cleaning
- durationMinutes is a float; other fields are strings; parse dates when loading into database.
- Handle records where events may be empty (skip or write none).
- Standardise deviceType (lowercase etc), maybe map country codes if needed.
Step 5: Schema validation and QA
- Check that every sessionId in session_events appears in sessions.
- Count distinct sessionId in sessions equals number of lines in JSON file.
- Spot-check durations for correctness.
- Spot-check event timestamps fall between start and end times.
Step 6: Load results
- Load sessions.csv and session_events.csv into data warehouse (e.g., BigQuery).
- Create foreign‐key relationship in session_events to sessions.
- Build dashboards: e.g., average session duration by device, event counts by country.
Step 7: Document transformation & maintain pipeline
Create README: “Daily JSON session export → Python script version 1.0 → CSVs → load to BigQuery.”
Monitor for schema changes: e.g., JSON adds new field “browser” or nested “campaign” data – update script accordingly.
Outcome
By following this structured approach, you have converted raw JSON logs into two well-defined tables, enabling analytics, reporting and cross-table joins. Your data pipeline is transparent, documented, auditable - increasing trust and reliability for stakeholders.
8. When Not to Convert - And Alternatives
While converting JSON to tables is often helpful, there are scenarios where it may not be the best approach:
8.1 Use case: Document/NoSQL rather than analytics
If your use case is simply storing documents for retrieval (rather than analysis), retaining JSON in a document store (e.g., MongoDB, Elasticsearch) may be preferable. In that case, trying to force a tabular view may lead to data loss or complexity.
8.2 High variability schema
If the JSON schema is extremely variable (many optional keys, nested arrays within arrays, evolving rapidly), maintaining tabular schema may become brittle. In those cases you may choose to keep the JSON as is, and only convert subsets of the data for specific analysis.
8.3 Real-time streaming large volumes
For high-velocity streaming JSON formatter online where you don’t need full analytics but only quick aggregations, you might use streaming tools that parse JSON on-the-fly and aggregate in memory rather than permanently storing a full table.
8.4 Hybrid approach
Often a hybrid approach works best: retain raw JSON in a “landing zone” for audit/archival, and derive simplified tabular extracts for analytics. This ensures you preserve full fidelity while supporting structured use-cases.
9. Why This Matters for Your Business / Analytics Strategy
From your position (digital marketing expert working with app, web and AI solutions at a company like online json formatter), why does JSON-to-table conversion matter?
- Unified data view: Web and mobile apps often emit logs/events in JSON. Converting to tabular format allows you to combine sources (app events + backend logs + CRM tables) in one analytics model.
- Faster insights: Analysts can query tables quickly for metrics like average session, drop-off events, funnel conversion - rather than parsing ad-hoc JSON.
- Better dashboards: With tabular schema, you can build dashboards that non-technical stakeholders understand and trust.
- Governance & scalability: A documented transformation pipeline supports governance, audits and easier scaling as data volumes grow.
- Improved SEO-content synergy: Since you are working on pillar content, service pages and blogs (as you mentioned), conveying data insights (extracted via such pipelines) lends credibility to your marketing analytics narratives. For example, if you show how user-behaviour data is cleaned and converted, your readers will trust your claims more (Expertise, Trustworthiness).
- Competitive advantage: Many organisations neglect properly structuring their event/log data. By investing in clean tabular outputs, you enable advanced analytics (predictive models, machine learning) which can distinguish you in service delivery.
Final Thoughts
Converting JSON to a tabular format is not merely a technical exercise - it is a strategic enabler for analytics, reporting, decision-making and business insight. By following a disciplined process - understanding your JSON source, defining your target schema, flattening or modelling relationally, cleaning and validating your data, loading it into appropriate systems, and documenting your pipeline - you ensure that raw data becomes organised output that stakeholders trust and use.